


Introduction
Total Petroleum Hydrocarbons (TPHs) are a broad term that includes all the chemical compounds found in crude oil. Total petroleum hydrocarbon refers to a large group of chemical compounds that originated in crude oil [1]. They are referred to as hydrocarbons since they are virtually entirely made up of hydrogen and carbon. They are found in the range of C8 through C40 as mixture containing hundreds to thousands of hydrocarbons comprising of aliphatic which are straight carbon chain and aromatic (carbon ring) compounds and may also contain priority pollutants including volatile organic compounds (VOCs), semi-volatile compounds [2]. Their existence in soil and water has led to serious concerns about their influence on plant and human [3]. The total concentration of all hydrocarbons eluting from n-nonane (C9) to n-hexatriacontane (C36), as well as the sum of aliphatic and aromatic hydrocarbons, particularly those belonging to the following group; C9 to C18 (aliphatic), C19 to C36 (aliphatic), and C11 to C22 (aromatic) can be used to determine Total Petroleum Hydrocarbons. Generally, Total Petroleum Hydrocarbon (TPHs) may not constitute an immediate adverse health implications and concern to human or have adverse climatic implication on the environment [4], however their presence demonstrates the adverse negative ecological state of the water body and can be utilized as a pointer with respect to contamination in sediments and waters [5-7]. TPHs have been linked to the occurrence of psoriasis and dandruff in children and are known to cause uterine, stomach, and oral cancers as well as neurological disorders. Haematological, immunological, neurological, gastrointestinal, and even potentially fatal conditions are brought on by aromatic petroleum hydrocarbons such as benzene, toluene. In human health risk evaluation, the hazard index and overall cancer risk were found to be a source of concern. This implies that children will eventually experience a range of health issues, including cancer [8]. Rapid industrialization [9] and the improper disposal of petroleum hydrocarbon wastes in the environment creates a modification in the chemical and physical properties of the surrounding soils and causes underground pollution when these contaminants leached into the underground water aquifers [10]. At the point when TPH is discharged into the environment deliberately or by accidental spillage, industrial waste and wastewater release and from domestic activities into the soil through spills or leakages [11], it leaches from the soil into underground water and a few organisms in the soil might separate a portion of the pollutants into more modest divisions while some might vanish into the environment, others will remain in the soil for a longer period which might have hazardous health implications [9]. TPH released into the environment will, according to the United State Environmental Protection Agency (USEPA), pose a threat to public health and safety by contaminating drinking water, posing a risk of fire and explosion, reducing the quality of the air and water, harming agriculture, destroying recreational areas, destroying habitats and food, and wasting non-renewable resources. Recovery from a petroleum hydrocarbon (TPH) contamination of the soil can take several years. Oil hydrocarbons polluted soil is a worry for various reasons. As a matter of some importance, once delivered into the dirt, the unpredictability of TPHs can represent a fire or even explosive risks, particularly when fume enter confined spaces. Impurities can disrupt supplement and water transmission resulting in degradation of the environment. Residues of TPHs might remain bound to soil particles and stay in the soil for a really long time. Even though contaminants may benefit from carbon source as a degrader, the majority of soil biota still find them toxic [5]. TPHs have the potential to ruin the aesthetic by creating an unpleasant taste, smell, or appearance in environmental media. Lastly, TPHs will pose a potential threat to the environment. TPH content in a sample can be used as a general indicator of petroleum contamination at a given location [5]. Petroleum hydrocarbons in organisms and exposed individuals often result in numerous health implications such as: disruption in the activities of various body organs, severe damage to the pancreas, kidney, liver, blood circulatory system, and ultimately death [12]. The aim of this research is to determine the concentration of total petroleum hydrocarbons in different groundwater samples in Orji auto repair workshops and also to assess the risk posed by consumption of such polluted water [18-20, 27].
Materials and Methods
Geographical Description of Study Location
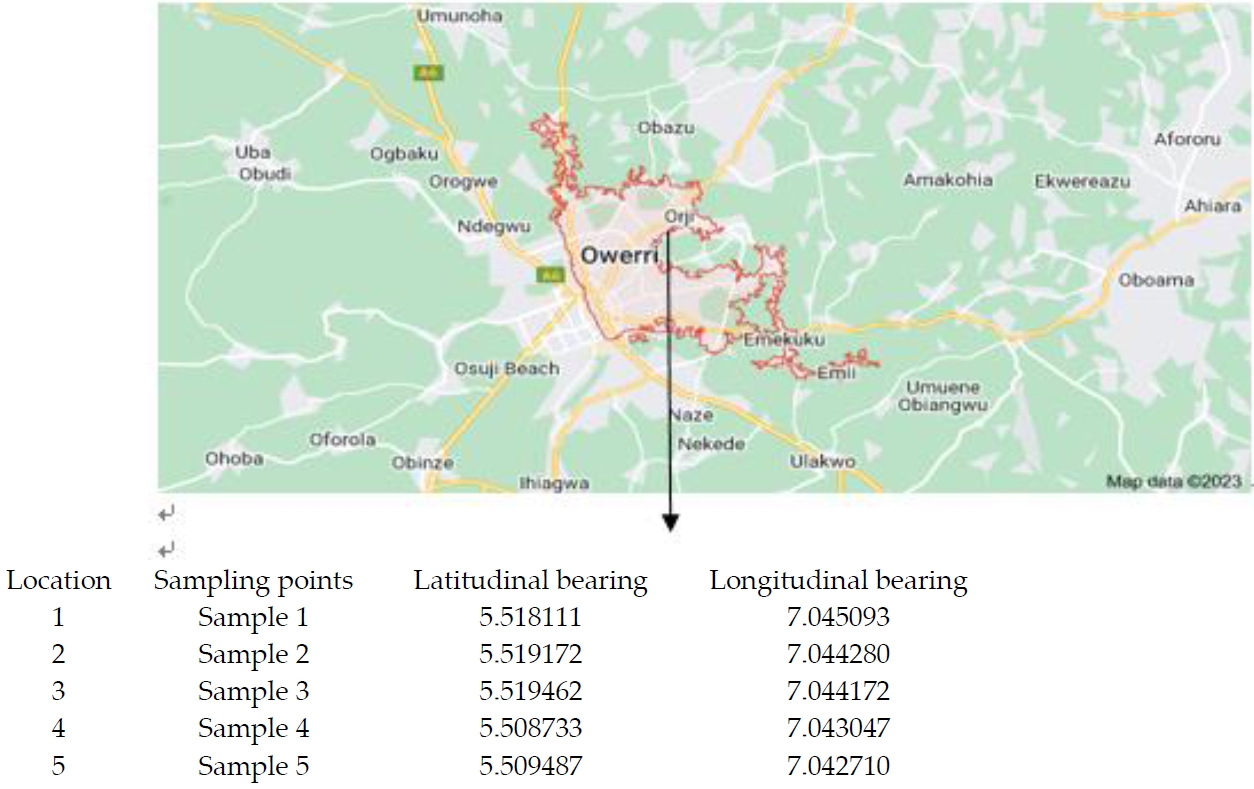
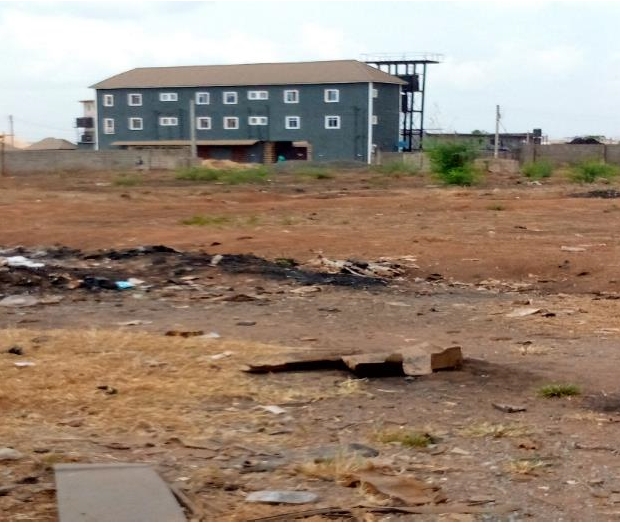
The Orji auto repair workshops situated in Owerri North Local Government Area, the Imo State's capital, between latitudinal bearing and longitudinal bearing presented in Figure1 and sits approximately 126 m above sea level, and covers an area estimating 410 m2, with operations in the mechanic village started in 1987 involving auto mechanics and other craftsmen who engages in automobiles maintenance.
Collection of samples
Water samples for Total petroleum hydrocarbons analyses were collected using a broad mouth 500mL volumetric flask fitted tightly with aluminium foil to prevent contamination of the samples. Glass bottles were used for the collection of samples to avoid interaction between hydrocarbons and containers, the collected water samples were properly labelled after which samples were preserved in cool boxes before for analyses were carried out.
Preparation of samples for TPH Analysis (AOAC 1990)
20 mL of acetonitrile and ethyl acetate were used to extract 5 mL of the sample (1:2). Using a separating funnel, the mixture was stirred and separated, with the top layer being used for examination. A vial with 1 mL of the layer in it was transferred so it could be analyzed.
Gas Chromatographic conditions for TPH determination
The residue levels of TPHs were quantitatively determined using peak area. The detector's linear range was used for the measurement. The peak areas whose retention times coincided with the standards were extrapolated on their corresponding calibration curves to obtain the concentration. The following settings were set for the oven temperature: 80 °C held for 2 minutes, ramped to 150 °C at 25 °C/min for 5 minutes, held for another minute, and then ramped at 10 °C/min to 300 °C. With a flow rate of 2.0 mL/min for the carrier gas and 29 mL/min for the detector make-up gas, nitrogen was employed. The GC's injection volume was 1L. A sample ran for 45 minutes in total.
Quantification of TPH residues
Using peak area, the residue levels of TPHs were quantified. The detector's linear range was used for the measurement. To determine the concentration.
Contamination Factor (CF) for TPH
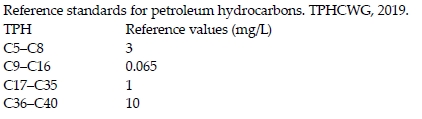
According to the US EPA, the contamination factor is the concentration of the TPHs of interest compared to the background value.
Some of the TPH background values utilized in this analysis were adapted from US EPA values (Verbruggen, 2012). Where, Cs = concentration of aggregate TPHs (mg/L), Cr = reference standards using TPHCWG 19. Mathematically, it is expressed as CF ≤ lower contamination, 1 < moderate, 3 < Considerable, 6 ≥ CF, high contamination20. The reference standards are shown below
Degree of Contamination (Cdeg) for TPH
This represents the total TPH contamination factor across all water samples.
Where n is the total number of TPHs present and CF is the contamination factor of the TPHs of interest.
Pollution load index (PLI) for TPH
This is the end result of all TPH contamination in various water tests.
Pollution load index (PLI) = (CF1 X CF2 X CF3 X CFn) 1/n
Where n is the total number of TPHs present and CF is the contamination factor of the TPHs of interest.
Total carcinogenic risk for TPH
The carcinogenic risk assessment is given by
Where the likelihood of experiencing a health effect is measured by the hazard index, HI and Hazard quotient is the probability that an adverse health effect is imminent (unitless). Hazard Index (HI) is the total of Hazard quotient (HQ) from dermal and ingestion, as the acceptable limit is 1.0
RfD is the reference dose in (mg/mL/day)

Results and Discussion
The number of total petroleum hydrocarbons (TPHs) detected in the water samples are presented in Table 1 in the groundwater of Orji auto repair workshops in Owerri, Southeast Nigeria. Over the years, this vicinity has been involved in a number of automobile maintenance activities that are known to release toxic hydrocarbons into the environment which most likely might have contributed immensely to the presence of total petroleum hydrocarbon (TPH) concentration in the groundwater of this area a result of leaching and flooding after rainfall. Apart from these maintenance activities, related emissions from associated petroleum industries including automobiles, diesel generators, and domestic chores like cooking and burning could have caused an increase in the level of TPHs in underground water as well [25, 28].
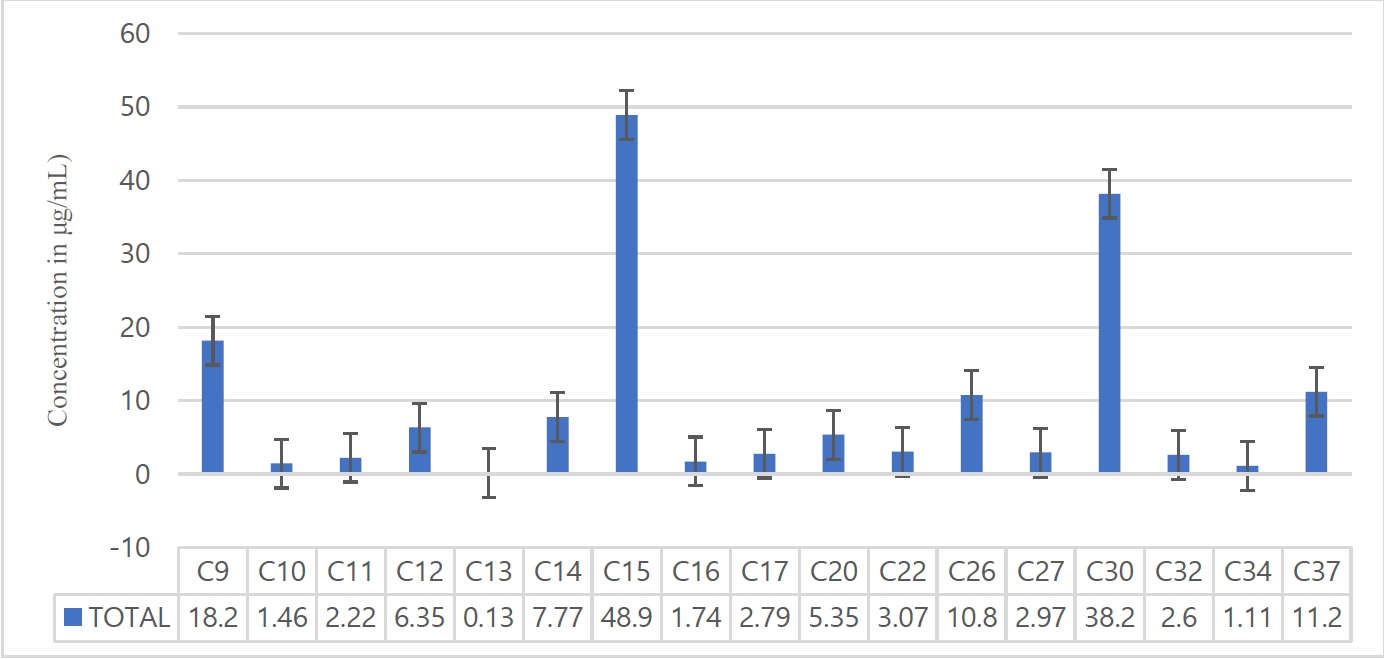
From the result obtained as shown in Figure 4, it is obvious that groundwater in this current study area is heavily contaminated with Total petroleum hydrocarbons with C15 (Pentadecane) having concentration as high as 48.90ug/mL, C30 (Triacontane) 38.18 ug/mL and C9 (Nonane) 18.18 ug/mL which could be as a result of both anthropogenic and natural chemical processes, such as volatilization, photo-oxidation, and biodegradation, combine with air moisture before atmospheric rainfall deposition, which might have impacted significantly on the quality of groundwater [13, 29].
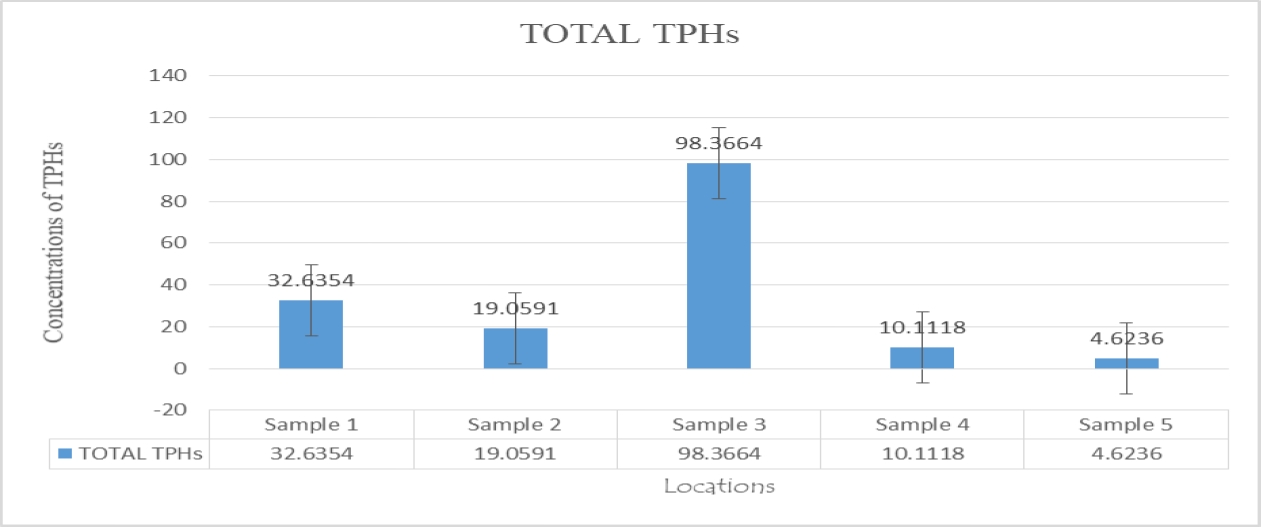
From the result obtained, groundwater in the current study area is heavily contaminated with Total petroleum hydrocarbons, concentration of TPHs in samples 4 and 5 are 10.118 ug/mL and 4.6236 ug/mL accounting for 6.14 % and 2.81 % respectively and are less compared to those obtained in samples 1, 2, and 3 which are 32.6354 ug/mL, 19.0591 ug/mL and 98.3664 ug/mL respectively, accounting for 19.8 %, 11.57 %, and 59.69 % an implication that sample 3 had the greatest concentration of TPHs as presented in Figure 5.
With respect to the carbon chain C15 and C30 are the most predominant with 29.6 7% and 23.17 % respectively, which indicates the presence of both low molecular weight and high molecular weight hydrocarbons while C8, C34 and C13 are the least with 0.88 %, 0.67 % and 0.08 % respectively as seen in Figure 6 and 7.
In this investigation, the water TPH level (168.33 g/L) was significantly lower than the values reported for the Niger Delta region. Groundwater from Ubeji in Warri, Nigeria [11] had 73,500 g/L of TPH, some groundwater samples from various villages in the Niger Delta were found to have significant levels of TPH (1352-12,110 g/L), Deepwater Horizon in the Gulf of Mexico [14], Malaysia's Dungun River Basin water [15], with reported TPH concentrations of 60,000–260,000 g/L and 12-41 g/L respectively and Israel's Levantine Basin, which was 19-88 g/L [16].
Distribution of Total Petroleum Hydrocarbons in groundwater
The highest amount of TPHs was found in sample 3 which constituted 59.69 % of the total TPHs obtained in the study were followed closely by samples 1 and 2 with 19.8 % and 11.57 % respectively, samples 4 and 5 had the least amount of TPHs with 6.14 % and 2.81 % respectively. With respect to the carbon chain, the percentage of Total petroleum hydrocarbons found in groundwater in samples are as follows: 30.46 % for C9 - C16 and 69.54 % for C17 to C35 for sample 1, 67.04 % for C9 – C16 and 32.96 % for C17 to C35 for sample 2, 58.98 % for C9 - C16, 29.67 % for C17 to C35 and 11.35% for above C35 for sample 3, 49.41 % for C9 - C16 and 50.59 % for C17 to C35 for sample 4, 21.77 % for C9 - C16, 77.15 % for C17 to C35 and 1.08 % for above C35 for sample 5. The largest amounts of detected hydrocarbons are C17 - C35 at sample 1, C9 - C16 at sample 2, C9 - C16 at sample 3, C17 - C35 at and C17 - C35 at sample 5, hydrocarbons above C35 were discovered at sample 3 and sample 5 presented in Table 2. Moreover, TPHs at higher carbon ranges are known to generate oily coatings that block some sunlight from penetrating, affecting poor water quality and eventually impairing taste and odour [21- 22].
Anthropogenic Source Identification of Total Petroleum Hydrocarbons.
Evaluation of the ratio of low to high molecular weight (L/H) revealed that the L/H ratio was less than one (1) for all sample locations except samples 2 and 3, indicating influence from pyrogenic source for samples 1,4 and 5, while samples 2 and 3 could be derived from (anthropogenic) petroleum sources.
There are both light and heavy carbon chains present, and it is believed that anthropogenic activity is responsible for the occurrence of these carbon groups [31]. With low molecular weight TPHs amounted to 9.9422 ug/mL, 12.7779 ug/mL, 58.0201 ug/mL, 4.9964 mg/ml, and 1.0066 ug/mL for samples 1, 2, 3, 4, and 5 respectively as presented in Table 3 and 22.6932 ug/mL, 6.2812 ug/mL, 40.3463 ug/mL, 5.1154 ug/mL and 3.617 for samples 1, 2, 3, 4 and 5 respectively as presented in Table 4. For Total petroleum hydrocarbons found in groundwater in samples 1, 2, and 3, the ratio of low molecular weight (LMW) to high molecular weight (HMW) hydrocarbons (LMW/HMW) was estimated to be 0.438 ug/mL, 2.034 ug/mL, 1.438 ug/mL, 0.977 ug/mL, and 0.278 ug/mL, respectively as presented in Table 7.
The high presence of C16, C18, and C20 is an indication that the total petroleum hydrocarbons are of anthropogenic origin also the dominance of an even number of total petroleum hydrocarbons over an odd number of hydrocarbons is also an indication of anthropogenic origin most likely as a result of indiscriminate disposal of petroleum product and leaching of these contaminations into underground water aquifers [23].
Environmental Risk Assessment
Also calculated were the contamination factor (CF), the pollutant load index, (PLI), and the degree of contamination presented in Table 8. Total petroleum hydrocarbons had cumulative CF of 175.65, 202.86, 922.91, 81.98, and 19.06 for samples 1, 2, 3, 4, and 5 respectively. The degree of contamination, which is calculated by accessing the CF, ranged from 19.06 to 922.91 with samples 1, 2, and 3 having the highest values of contamination indicating an extremely high amount of contamination in all the water samples. The PLI was computed in conjunction with the number of variables investigated and was more than one (1), indicating TPH pollution in all samples. When compared to humans who consume water from these sources, the results of the ecological risk analysis showed that the detected TPHs contaminants pose a high ecological risk. (USEPA, 2007, WHO, 1999) [24].
Human Health Risk Assessment
Average Daily Intake (ADI)
The average daily intake (ADI) of Total petroleum hydrocarbons (TPHs) for adults and children was determined and presented in Table 9 for carbon chain C9- C18, C19- 32, and C33 to C40, the average daily intake (ADI) of groundwater for adults and children were determined using two exposure pathways: (ingestion) oral and dermal (skin contact). ADI Dermal for adults varied from 1.08E-01 mg/kg/day to 8.51E-03 while ADI injection for adults varied from 9.96E-04 mg/kg/day to 7.88E-05 mg/kg/day for carbon chain C9-C18. With respect to ADI Dermal for adult sample 3 has the highest daily intakes for all carbon chain groups with C33 to C40 having no daily intakes values in sample 1. A similar trend is observed for ADI Dermal for children [26].
Results of the hazard index (HI) in both adults and children.
The hazard quotient index (HI) of Total petroleum hydrocarbons was determined through exposure paths HQ (ingested) and HQ (dermal). HI followed a similar trend as ADI Ingestion and dermal with sample 3 having the highest HI values. Hazard Index (HI) for exposed pathways obtained was used to evaluate carcinogenic risk in both adults and children. These results indicate that Children's values were higher than adults' according to the preliminary evaluation of the ADI and the hazard index (HI), as shown in Table 10, indicating that there is an inherent health risk. HI was higher than one (1) for carbon chain C9 – C18 in samples 1, 2, and 3 for children and adults.
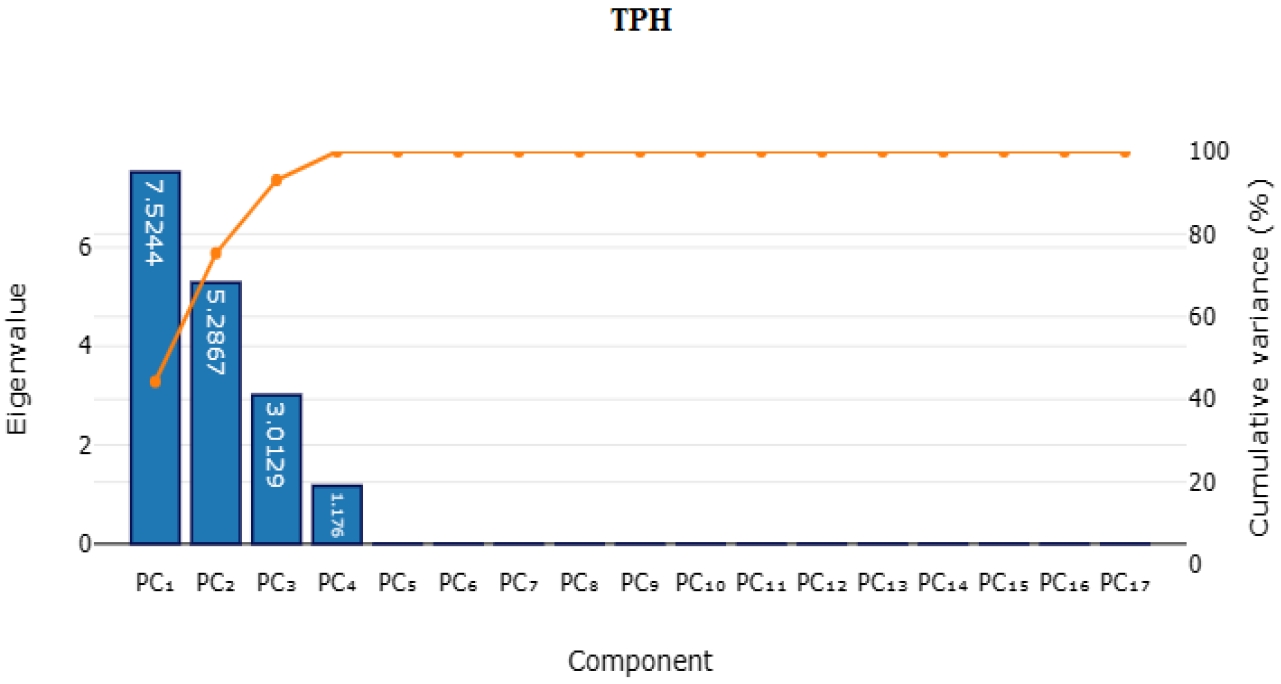
PCA PLOTS FOR TPHs
The principal component analysis is a statistical technique used to group data sets into a linear regression (y = mx + C) between 0.00-0.99. (Strong, medium, and weak regression). Analysis of the principal components. As shown in Table 11, total petroleum hydrocarbons (TPHs).
The occurrence of a negative correlation indicates the presence of both identical and dissimilar contamination in addition to biological interaction while positive components are caused by the presence of TPH components from different sources, either petrogenic or pyrogenic sources. Strong positive correlation exist between C9 and C19, C14, C15, C27 and C33, between C10 and C14, C15, C27 and C37 between C11 and C20 and C34, C13 and C32, C14 and C27, C15 and C37, C17 and C32, while we have medium negative correlation between the following carbon chains, C 12 and C32, C13 and C12, C17 and C26, C26 and C34 as presented in Table 11.
Principal Component Analysis (PCA) is a technique that reduces the number of dimensions in data while minimizing the loss of information. The approach works by rotating the axes to increase variation along them and then translating the data into principal component values, often known as scores. These primary elements act as the new axis and the PC scores represent the predicted observations of the original magnitude of the new axes.
The principal component-1 (PC-1) explained 44.3 % as shown in table 12 of the overall variation and was more heavily loaded with HMW TPHs (C20, C26, C30, and C37) than LMW TPHs (C9, C12, C14, and C15). This suggests that the sources of these groups of TPHs are similar to those observed by the diagnostic ratio. Pyrogenic processes, such as combustion, are most likely responsible for the LMW TPHs Diesel and gasoline are primarily made up of High molecular weight TPH Molecules, when disposed of improperly can result in contamination. As a result, PC-1 depicts the anthropogenic sources of TPHs from incomplete fuel combustions, which is a major occurrence in the region as well as the anthropogenic disposal of fuel products, used engine oil, lubricating, and a lot of other substances which contain TPHs without considering the impact on the environment. [26]
Principal component-2 (PC-2) analysis explained 31.1% of the overall variance, whereas principal component-3 (PC-3) analysis only explained 17.7%. The main TPHs present in PC-3 are closely related to those found in PC-1 and occur in high concentrations in both PC-1 and PC-2, which shows that these TPHs derive from a variety of sources [30].
Conclusions
In this research the anthropogenic source determination and risk evaluation of total petroleum hydrocarbons (TPHs) in different groundwater samples as well as their risk assessment within Orji auto mechanic village, Imo State, Nigeria was conducted. The outcome of this research ascertained the presence of total petroleum hydrocarbon pollution indicating an inherent health risk in the consumption of these water without proper treatment. It could be inferred that the anthropogenic activities of artisan within this vicinity and seasonal contribution due to rainfall and leaching are responsible for the occurrence for the presence of Low molecular weight and high molecular weight TPHs contamination in the study area. Hence the likely sources of TPHs in this study are both pyrogenic and petrogenic. TPHs concentration levels determined, contamination factor as well as pollution load index, Average daily intake, degree of contamination and Heath quotient index all revealed that the groundwater sources are contaminated and unsafe for human consumption due to the contamination level and risks associated with their consumption. There is the need to set up inspection protocol for water contamination to help proffer a realistic strategy and remedial approach to avoid potential health issues in the future. This study also serves as an appeal to relevant government agencies and stakeholder on the need for provision of potable water as well as comprehensive remediation process within this vicinity.