


Introduction
Heavy elements are considered as systemic toxicants that can induce various health hazards even at low levels of exposure. They are generated by various natural processes and anthropogenic activities. Contamination of heavy elements in aquatic ecosystems can occur from various sources, such as direct deposition from the atmosphere, natural geological erosion, as well as the discharge of waste products from agricultural, urban, residential, and industrial activities [1]. Most of these metal pollutants, including heavy elements, tend to accumulate in aquatic environments, effectively making them sinks for these substances. To ensure the sustained health of aquatic systems, periodic examination of sediments and water samples is of paramount importance. Savannah river flows southeastward for approximately 300 miles, passing through the diverse geographical areas before it ultimately reaches the Atlantic Ocean, roughly 10-15 miles south of the Savannah city. Unfortunately, the Savannah River ranks as the third-most contaminated river in the nation, which is attributed to the multitude of industries and chemical factories lining its banks, indiscriminately discharging industrial pollutants and municipal sewage into the river [2-3].
Due to increased industrial activities, the majority of pollution occurs in the Savannah River between Augusta and Savannah, Georgia. Various sources, including rock erosion, soil degradation, and the dissolution of water-soluble salts, also introduce heavy elements into the river. Elements that occur naturally usually pass through aquatic environments without inducing any harm [4]. However, the growth of housing populations and emerging industries near the Savannah River and its tributaries caused the deterioration of the quality of river water [5]. Some elements though toxic at high concentrations is essential for biological metabolism of living beings in small quantities, while others, even in small amounts, pose hazards despite being non-essential [6]. As the Savannah River serves as a crucial water source for a growing downstream population, safeguarding its water quality is of paramount importance to protect both human health and the aquatic ecosystems [7].
This study primarily focuses on various heavy and toxic elements such as Zn, Cr, Se, Fe, Cd, and Al, which play essential roles in metabolic processes in organisms but can also be toxic at higher exposure levels, potentially endangering the health of various aquatic species and humans [8-9]. Heavy element pollutants like Zn, Cr, Cd, Fe etc. primarily enter aquatic environments through mineral and soil weathering as well as atmospheric deposition [10], and also from industrial effluents, domestic effluents, urban stormwater runoff, and spoil heaps due to human activities [11-12]. These heavy elements tend to accumulate in plants and animals through different routes over a period of time [13].
The literature review indicates a limited research concerning a comprehensive assessment of the spatial trend of heavy metal pollution levels throughout the Savannah River, encompassing both water and sediments, extending from the river's head to its estuary. While various studies have focused specific regions of the Savannah River, such as environmental parameters at the Savannah river harbor and the National Wildlife Area [14], pollution level in lower Savannah river watershed [15], the metal concentration in the Savannah River Site Environment [16] and metals and chemical contamination in Savannah River Estuary [17]. All these studies focused on various environmental pollution parameters for those particular areas of the Savannah River. Furthermore, literature is available on heavy metal concentration in various aquatic receptors like fish, as explored by Burger et al., with correlations drawn to heavy metal contamination in the region [18]. The significance of this study is to explore and investigate the spatial trends of heavy elements in both water and sediment in Savannah river, spanning from the head to the estuary. Not only does this research contribute to the existing literature, but it also sheds light on the origins of heavy elements in the Savannah River and identifies specific regions where increased concentrations may be attributed to industrial and commercial effluent discharge. Moreover, the study reveals insoluble deposited metal contamination in sediments across different locations along the Savannah River over the years, contributing to prolonged river contamination. Given the pivotal role of the Savannah River in supplying water for residential and agricultural use downstream, conducting regular investigations becomes imperative to address potential health risks. The outcomes of this research serve as a foundational resource for pinpointing areas with elevated concentrations of heavy elements within the Savannah River. This information, in turn, facilitates the formulation of effective pollution control measures, ensuring the continued health and sustainability of the river ecosystem and safeguarding the well-being of those dependent on its waters for various purposes.
Materials and Methods
Study area
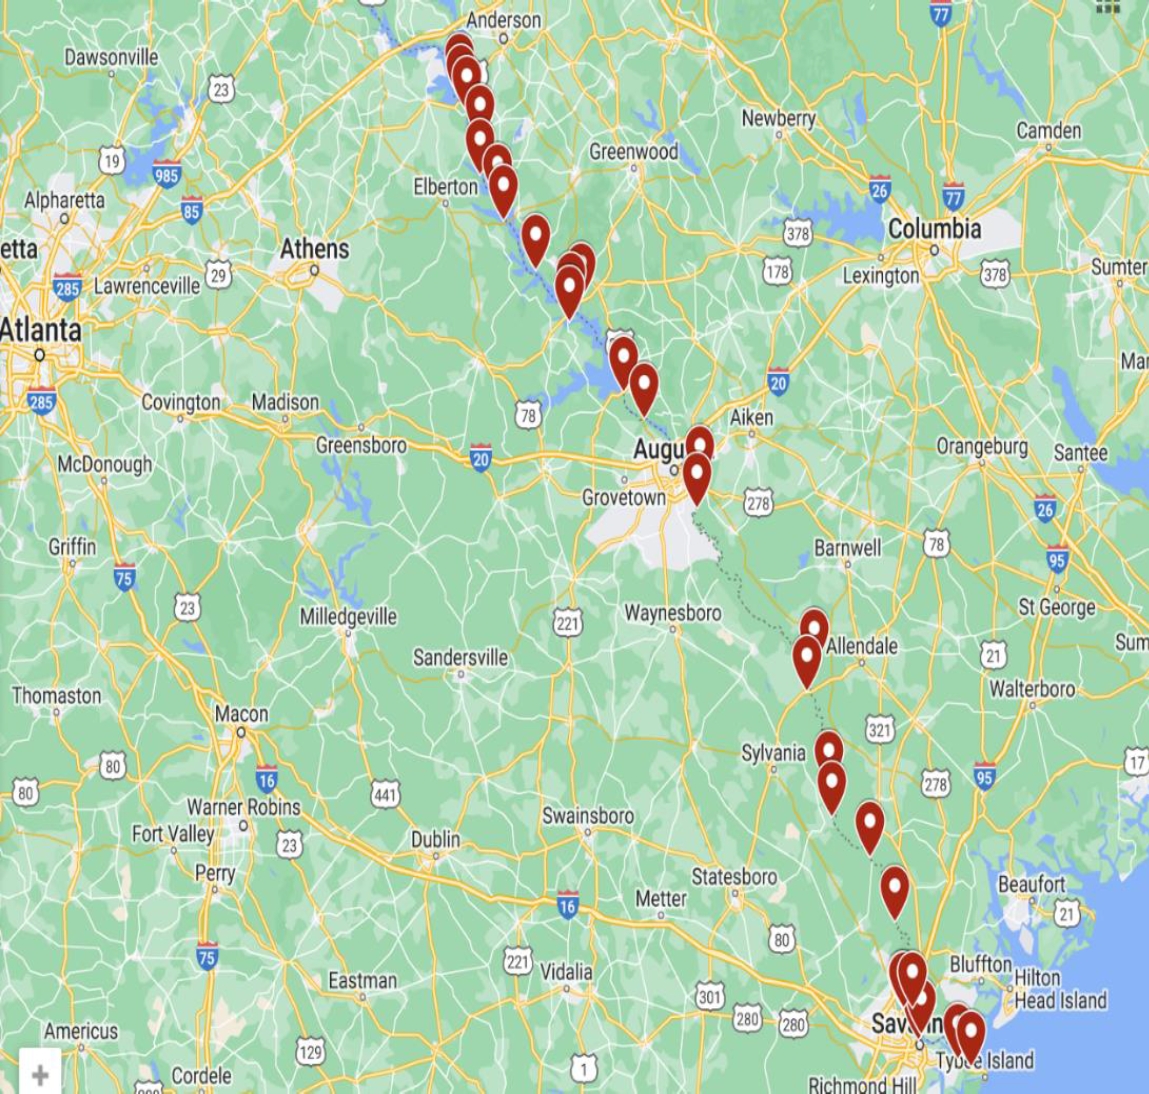
Savannah river flows through southeastern region of the United States, delineating a significant portion of the boundary that separates South Carolina (SC) and Georgia (GA). It flows through various landscapes, including forests, agricultural fields, expansive hydroelectric reservoirs, and extensive marshes on its way towards Atlantic Ocean. Moreover, this area known for its imposing bluffs, some of which once hosted ancient Native American villages. The Savannah river supplies potable water to two major urban centers in Georgia, namely Augusta and Savannah, while also serving as a receptacle for their treated wastewater. Additionally, it serves as a vital water source for numerous smaller towns within its basin. In specific areas like Augusta, McCormick, and Savannah, the Savannah River flows through industrialized zones characterized by the presence of steel and chemical manufacturing facilities, as well as various other industries. Some of these industrial sectors have the potential to release treated effluents into the river. Over the years, the Savannah River estuary has faced substantial contamination from sewage and industrial discharges. As per the studies conducted by Nature Conservancy of Georgia, even though the Savannah river system showcases the scenic charm and abundant biodiversity, its ecological health is experiencing a marked decline from its origins to the estuary [19]. Due to the expansion of industry and land development, the Savannah River faces the imminent threat of pollution from heavy elements, sedimentation, and diminishing levels of dissolved oxygen. Due to the reasons mentioned above, Savannah river was selected for this study. Sampling locations along the Savannah river juxtaposed on the Google map is shown in Figure 1.
Sample collection and pre-processing
Surface sediment and water samples were collected from 30 locations along the Savannah River, from Anderson, South Carolina, to Savannah, Georgia. The distance between sampling locations ranged from 8 to 10 miles, depending on access to the Savannah River. No samples were collected near Savannah River Site (SRS) area due to restricted access. The discrete sampling strategy was employed according to the United States Department of Agriculture (USDA) procedure to collect water and sediment samples [20]. Each location contributed individual samples stored in separate HDPE containers with clear labels. To ensure cleanliness, sampling containers were rinsed with distilled water and then with sampling water at the location after pre-conditioning with a 5% nitric acid solution. These polyethylene containers were immersed to a depth of about 10 centimeters below the river's surface, aligned with the current for water collection. Approximately one liter of water was extracted at each site and filtered through a 0.45 μm Millipore filter. The samples were then stored in an ice chest during transport and refrigerated at approximately 4°C in the laboratory until analysis. Sediment collection was meticulously performed to prevent contamination. Pre-cleaned polyethylene shovels were used to scoop sediments from a depth of 1 to 4 centimeters and transferred into pre-cleaned polyethylene bags. These sediment samples were dried at 60°C for 24 hours in a Thermo Isotemp oven by Thermo Fisher, USA. After thorough drying, the sediments were sieved through a 0.25 mm mesh to remove organic materials, stones, and large particles. Subsequently, each sample was finely pulverized using the SPEX ShatterBox 8530's ring and puck alumina mill for 3 minutes to achieve a uniform powdered mixture.
Instrumental neutron activation analysis
Dried and pre-processed sediment samples weighing 0.2028 grams were sealed in LDPE vials for irradiation. In the case of liquid samples, 3 ml of each sample was pipetted into LDPE vials and sealed. The elemental concentrations were determined using a relative standardization method. Two reference materials were employed for the analysis of sediments: waste incineration ash, (Umwelt Reference Material), sourced from the Federal Institute for Materials Research [21], and SRM 1648a, (Urban particulate matter), supplied by National Institute of Standards and Technology (NIST) [22]. For liquid samples, SRM 1643c [23] and 1643d [24] from NIST were employed. Both the standards and the samples underwent irradiation in the same neutron flux.
PULSTAR nuclear reactor at North Carolina State University was utilized for irradiation of the samples [25]. Two different schemes were employed to estimate short lived and long-lived isotopes formed during irradiation. A short irradiation lasting 30 seconds was carried out using a pneumatic transfer rabbit system. The thermal neutron flux near the reactor core during this irradiation was 1.0 × 10¹³ neutrons.cm-2s-1. Conversely, a long irradiation lasting 6 hours in a neutron flux of 1.0 × 10¹¹ neutrons.cm-2s-1 was carried out in 3.5-inch dry sample pool standpipes of the reactor core. To measure medium/long-lived isotopes, these samples were allowed to decay in the reactor pool for seven days before being retrieved for gamma spectrometry.
Gamma spectral analysis and quantification of short-lived and medium-lived isotopes was achieved using two high-purity germanium (HPGe) detectors with relative efficiency 38 % and 42 % respectively. These detectors were equipped with standard electronic components, including a High-Voltage Supply (HVS), Analog to Digital Converter (ADC), Multi- Channel Analyzer (MCA). They were connected to a Windows 7 PC running Genie 2K software from Canberra. In the case of short irradiated samples, counting was conducted for 600 seconds after a decay time of 1-2 hours, ensuring that the detector's dead time remained below 8%. Counting of long irradiated samples was conducted after one week and one month, respectively, to estimate the presence of various elements with medium and long half-lives.
Calculation and Quality Control
The concentration of elements in the sample is determined using the standard relative method, which involves irradiation and gamma spectrometry of reference and sample materials [26]. In this method, both the sample (indexed as S) and the reference material (indexed as R) are irradiated at the same locations, ensuring that both samples are exposed to identical flux parameters. As a result, the concentration of a specific element in the sample, denoted as S, can be expressed as follows:
whereMA is the atomic mass, λ denotes the decay constant, PS represents net counts for gamma-ray peak of the characteristic energy Eγ, ms indicates the mass of the sample, θ signifies the isotopic abundance of the target isotope, NAv corresponds to Avogadro's number, Φ stands the thermal neutron flux, σ denotes the effective neutron cross-section, Γ expresses the probability of a disintegrating nucleus emitting a photon of Eγ, ϵ represents the detector efficiency at Eγ, ti denotes the total irradiation time, td signifies the decay time between end-of-irradiation and start-of-counting, and tc stands for the total counting time of the spectrum of the sample.
For the same element in the reference R, following the same logic, the concentration is given by:
Dividing Equation (1) with Equation (2) and rearranging yields:
By utilizing Equations (1) and (2), concentration of the element of interest Cs can be estimated as many parameters are nullified due to the fact that both the sample and the reference undergo irradiation under identical experimental conditions. Consequently, the concentration of the specific element in the sample can be directly determined using Equation (3), with the knowledge of other variables such as the counting time, irradiation time, net count ratio of the sample to reference, and the mass ratio of the reference to the sample.
We utilized two standard reference materials, SRM 1643c and 1643d (NIST Trace elements in Water) for INAA of water samples. SRM 1643d served as the reference standard for determining elemental concentrations in Savannah river water samples, while SRM 1643c was employed for internal quality control. Elemental concentrations in SRM 1643c were estimated using SRM 1643d as a reference, and the corresponding errors were calculated. Table 1 presents the elemental concentrations in SRM 1643c that exhibited deviations from their certified values, along with the associated percentage errors.
Results
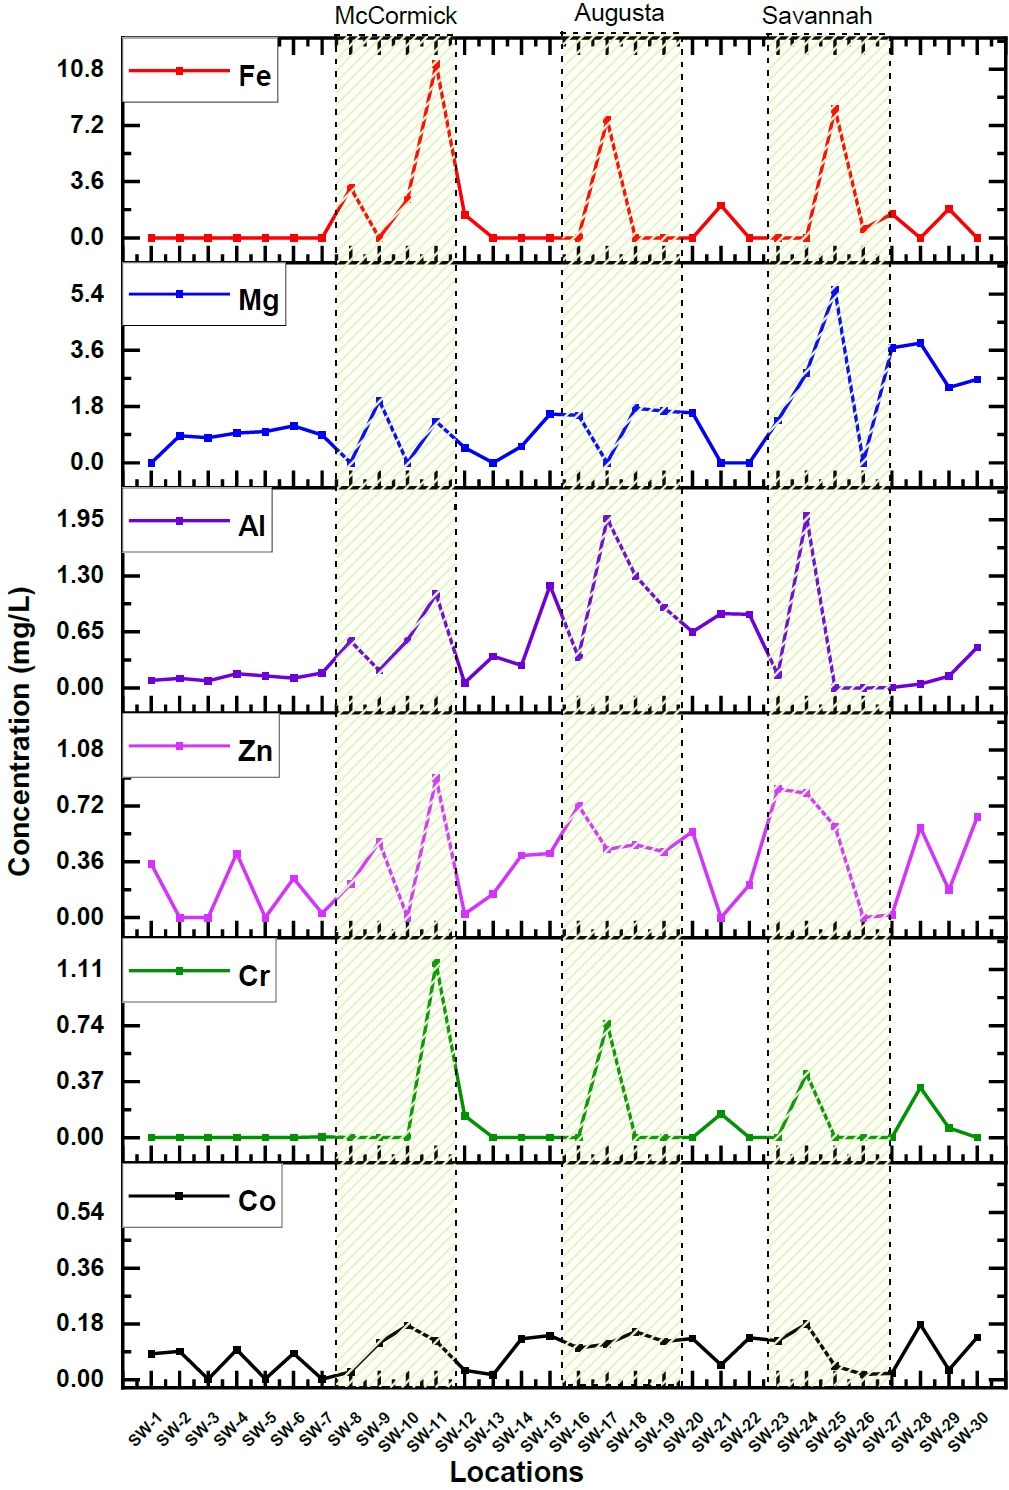
The elemental concentration and their corresponding uncertainties were calculated in river water samples collected from 30 different locations. Among the elements, some like Co, Cr, Zn, Al, Mg, and Fe, showed apparent variation in their concentration along the length of the Savannah River. Figure 2. Illustrates these variations in concentrations of these particular elements.
The majority of the components exhibited a notable increase in concentration, particularly within three specific areas situated along the Savannah River: McCormick, Augusta, and Savannah, as illustrated in Figure 2. When examining sampling sites near the city of McCormick, it became evident that there was a notable elevation in levels for Mg (1.32 mg/L), Cr (1.156 mg/L), and a significantly substantial surge in Fe (110 mg/L) compared to upstream measurements. Similarly, the proximity of Augusta displayed elevated concentrations of Cr (0.75 mg/L), Fe (72.6 mg/L), Mn (0.14 mg/L), Mg (1.56 mg/L), and Al (1.97 mg/L). In the city of Savannah and the downstream regions, there was an observable increase in elemental concentrations, notably for Cr (0.4 mg/L), Zn (0.59 mg/L), K (70.16 mg/L), Na (232 mg/L), Mg (5.52 mg/L), and Al (2 mg/L). These results underline the fact that there are significant variations in elemental concentrations along the Savannah River and also emphasize the influence of either geographical or human factors in determining river water pollution. But, McCormick, Augusta, and Savannah are experiencing rapid industrialization and growth. These urban areas consist of wide range of industries, including steel production, metal tool manufacturing, industrial bearing production, chemical and glass manufacturing, and oil refining. The elevated concentrations of these heavy elements in the Savannah river water near these cities are likely a result of industrial waste disposal into the river. Additionally, in the downstream sampling locations of Savannah, higher concentrations of K and Na were also detected. This can be attributed to the brackish water formed at the estuaries near the river's mouth [27].
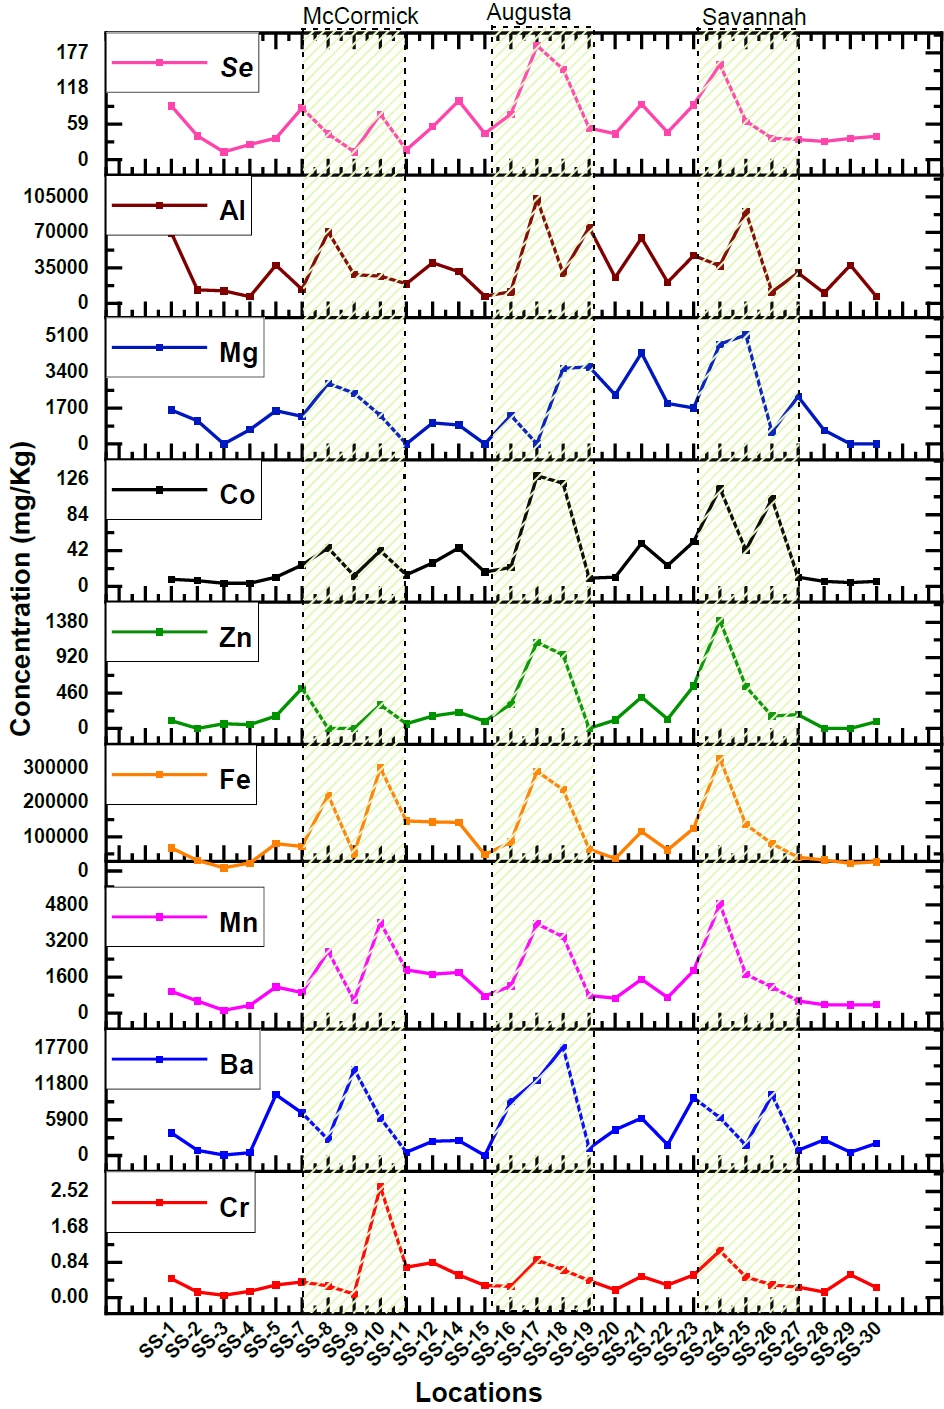
While water is commonly used to assess pollution levels in aquatic environments, like the presence of heavy metals, an alternative and more comprehensive approach involves examining sediment samples. Sediments can provide valuable insights into the long-term pollution status of aquatic ecosystems [28]. Therefore, sediment samples were collected along the Savannah River to determine variations in concentrations and to identify areas of higher concentration. The sediment samples exhibited elevated levels of potentially harmful heavy elements, primarily due to contamination from industrial wastewater. However, the specific concentrations of these elements showed variations depending on the sampling depth and proximity to industrial discharge points, such as sluice gates. Nevertheless, the consistent presence of heavy elements in the sediment serves as a clear indicator of industrial pollution in the aquatic environment. Among the elements analyzed (Cr, Zn, Mn, Fe, Se, Ba, Mg, V, Al), a significant increase in concentrations was observed, particularly at three distinct locations, as illustrated in Figure 3. This graphical representation highlights three specific regions where the majority of these elements were found at higher levels. Heavy element concentrations in the sediment were significantly elevated in the cities of Lincolnton, Augusta, Jackson, and Savannah, indicating that metals are being deposited in downstream sediments originating from industrial discharge points. These findings provide substantial support for the conclusions drawn from the analysis of water samples, reinforcing the evidence of industrial pollution in the Savannah River ecosystem.
Discussion
Analysis of Savannah River Water
The elemental concentration in savannah river water at industrialized and developing cities such as McCormick, Augusta, and Savannah cities were compared to the average elemental concentration upstream of the Savannah River (Anderson, SC). This comparison assumed that the elemental concentration at the beginning of the Savannah River is a result of natural processes without any anthropogenic contamination. Table 2 lists the concentrations of heavy elements in both the upstream areas and industrialized cities like McCormick, Augusta, and Savannah comparing them to the limits set by the World Health Organization (WHO) and the United States Environmental Protection Agency (USEPA). Adverse effects on humans and other animals are expected in the case of higher elemental concentration that exceed biodiversity standards. While scientists and ecotoxicologists generally use fish as an indicator for assessing the quality of aquatic life environment [29], analyzing the water and sediment in the area would provide much more insight into the level of contamination in the surface waters. Therefore, it is imperative to investigate individual metal elements that consistently show higher concentrations in river systems as the surface water is serve as a primary source of drinking water for communities along Savannah river banks. Hence, the results of this investigation is compared with the guidelines provided by the US EPA for freshwater [30] and the potable water limits set by the WHO in 2011 [31].
Table 2 provides clear indication of increase in elemental concentration of certain heavy elements within the Savannah River water as it approaches industrialized and developing cities when compared to the concentrations measured further upstream. This observation has crucial implications for understanding the impact of various anthropogenic activities and urbanization on water quality. Human activities, including the use of chemicals in agriculture and improper disposal of industrial and municipal wastes, significantly contribute to the presence of heavy metals in water sources [32-33]. These anthropogenic activities release substantial amounts of heavy metals into the surroundings. Particularly, one of the major pathways for heavy metal contamination in the environment is through surface and groundwater. Rivers that traverse through populated and industrial areas are particularly susceptible to heavy metal pollution due to the combined effects of urbanization and industrialization activities along these water bodies [34]. The concentration of heavy metals in rivers flowing through such areas tends to be higher, posing a potential threat to the aquatic ecosystem and, subsequently, to human health. Therefore, the spatial trend, as we move downstream from less populated and industrialized regions to more urbanized areas, becomes vital for identifying potential pollution sources and assessing their environmental impact.
Though Chromium is one of the most naturally existing elements in the earth crust, the maximum allowable concentration for Cr in freshwater is 0.57 mg/L by USEPA and is further stipulated to 0.05 mg/L by WHO for potable drinking water due to health concerns involved. Monitoring Chromium levels is highly significant due to previous incidents of high chromium in drinking water in California and North Carolina respectively, resulting from various anthropogenic activities [35-36]. The increase in Cr concentration from the stipulated 0.05 mg/L and from upstream locations of the Savannah River to levels higher than the guideline values at McCormick, Augusta, and Savannah cities is attributed to the industries of pigment production, glass, and steel at these locations. Similar increased concentrations of high Chromium in different areas of water bodies in Nigeria close to steel and pigment production industries were reported by Izha et al. [37]. Fish are ideal indicators of heavy metal contamination in aquatic systems as they occupy different trophic levels and encompass various sizes and ages [38]. Winger et al. [14] reported higher concentrations of Cr in fish from the Savannah River, comparable to those reported by Elwood et al. [39] for fish from a contaminated lake and by Lucas et al. [40] for fish in the Great Lakes. This indicates that the concentration of Chromium in the aquatic environment is higher in the Savannah River, viewed as presumptive evidence of contamination.
Zinc (Zn) is one essential element of human body and the permissible limit for Zn in fresh water is 0.12 mg/L as given by USEPA. However, recent studies by WHO, by considering the daily requirement for an adult (15-20 mg/day), have established a limit for Zn in drinking water 3 mg/L. An increased concentration of 2-4 times the average concentration in upstream (3-6 fold higher than stipulated limit) is observed in the industrialized cities. A much higher values in McCormick, Augusta and Savannah above the upstream values could be due to discharge from the anthropogenic effects [37] and similar instances of higher concentrations of Zinc near industries was noted in Nigeria. Zinc mainly reaches from steel and iron industries where Zinc coating is used for galvanizing and also from acid mine drainage [41].
Iron (Fe) is found in diverse environments including soil, air, and natural fresh water, though in low concentrations. Fe is categorized as a non-priority pollutant by the USEPA, with a permissible continuous concentration limit of 1 mg/L in fresh water. However, since iron is virtually tasteless at concentrations below 0.3 mg/L, WHO and USEPA have established a more stringent health-based standard for Fe in potable water, setting the maximum allowable limit at 0.3 mg/L. Unfortunately, the industrialized cities along the Savannah River, such as McCormick and Augusta, have shown alarmingly elevated iron concentrations, roughly 70-100 times above the permitted limit designated by USEPA. The high iron content observed in river or water systems is generally influenced by the geological characteristics of that area. The higher values, observed up to 43.09 mg/L in the Niger Delta, were found to be attributed to the geology of the area [42]. However, the observed increase in iron concentration in the Savannah River, especially in urban areas with intensive industrial activities like steel and metal manufacturing, can be directly attributed to anthropogenic influences in proximity to the water source. The very low iron concentration (1.1 mg/L) upstream of the Savannah River has proven that the elevated concentrations, up to 70 - 100 times higher, are due to anthropogenic activities. Besides, a higher iron concentration range found in fish (29-117 μg/gm) and fiddler crab (29-1886 μg/gm) in these areas of Savannah River as reported by Winger et al. [14] substantiates the higher level of iron contamination in the river.
Aluminum (AI), despite being a lightweight metal widely used in industries, is a highly abundant metallic element in the Earth's crust. The USEPA has established a limit of 0.75 mg/L for aluminum in freshwater to safeguard aquatic life and adverse health effects to human. While there is no concrete evidence of acute toxicity to humans from orally ingested aluminum, there is a hypothesis that aluminum exposure may increase the risk of Alzheimer's disease or accelerate its onset. Consequently, the WHO has imposed a health-bafsed threshold of 0.9 mg/L for aluminum in drinking water. The concentration of aluminum in the Savannah River surpasses the safe limit, exceeding it by 1.5-2.5 times the guideline value of the USEPA. This elevated aluminum content, much higher than the upstream concentration, not only poses a threat to aquatic biodiversity but also heightens the potential for health hazards among humans. Various human activities contribute significantly to the presence of aluminum in the air and water. Various mining and aluminum manufacturing industries near Augusta and Savannah could be the reasons for aluminum contamination in the Savannah River. Emissions from aluminum production industries, coal combustion, mining, waste incineration, and motor vehicle exhaust all contribute to higher aluminum concentrations in the atmosphere [43].
Silver (Ag) is a naturally occurring substance, and it is typically found in groundwater and surface water at a concentration of around 0.005 mg/L. Research has shown that the retention rates of silver in both humans and laboratory animals are quite minimal and hence, WHO has not specified any guideline value for silver in drinking water. In contrast, the USEPA has set a limit of 0.0032 mg/L for silver in freshwater. Water samples from the Savannah river did not exhibit an alarming increase in silver concentration.
While Cobalt (Co) is considered one of the important trace metals necessary for organisms, excessive levels of this element can be detrimental. Most of the states in United States of America have water sources with Co concentrations ranging from 1 to 2 parts per billion (ppb), except for those regions with abundant cobalt-containing mineral deposits [44]. The Savannah River, on average, contains a cobalt concentration of 0.01 mg/L, slightly higher in some urban areas. Cobalt generally enters into water sources through combustion of coal or oil or use of Co related chemicals in industries [37]. Neither the WHO nor the USEPA has established specific limits for cobalt in surface water. Cobalt residues in fish from savannah river did not appear to be unduly high in channel catfish as reported by Winger et al. [14] demonstrating a low cobalt concentration toxicity in savannah river.
Manganese (Mn) is a vital element often found in combination with Fe and is essential for living organisms. Mn is extensively used in industries such as steel and iron manufacturing, as well as the oil industry. In the Savannah River, the average Mn concentration is 0.006 mg/L. The WHO has established a health-based guideline value of 0.4 mg/L for manganese in drinking water, derived from dietary surveys based on a maximum daily intake of 11 mg/day. However, the USEPA has not set any specific limits for manganese in freshwater or surface water, whereas the health-based value is specified at 0.05 mg/L. Analysis of Savannah River water has shown that manganese concentrations are well below the WHO guideline, while they are slightly higher compared to the USEPA health-based values. Typically, manganese occurs naturally with iron and is used as an oxidant for cleaning, bleaching, disinfection processes, and in the production of iron and steel alloys [31]. A slight increase in manganese concentration in industrialized areas could be due to the unsustainable discharge of wastes into surface water. Similar observations of elevated concentrations of manganese in fish, up to (42.2 μg/g) in the Savannah River, were noticed, though manganese is not highly toxic to fish [14].
The drinking water can be a contributor to calcium and magnesium intake and it related to the hardness or softness of water and could be important for those who are marginal for calcium and magnesium. Since there is no conclusive evidence from epidemiological studies for cardiovascular risk due to Mg, no guideline values for minimum and maximum were not provided [31]. Alarmingly high Mg concentration was not noticed in Savannah river.
The concentrations of Cr, Zn, Mn, Fe, and Al were found to exceed recommended levels throughout the entire length of the Savannah River except the upstream areas. These increased levels were predominantly observed in three distinct regions—McCormick, Augusta, and Savannah. Furthermore, it has been realized that these cities are experiencing rapid growth and industrialization, serving as homes to numerous Steel, Iron, and industrial bearing manufacturing industries. The majority of Steel and Iron manufacturing facilities generate slags, which can either be utilized as byproducts or treated as waste materials. These slags contain metallic elements such as Al, Cr, Se, Zn, Ba, Mg, Mn, Fe, Cu, etc. in different proportions [45]. While these metals in the slag are not actively leaching, it is impossible to entirely mitigate the risk that precipitation and water runoff may transport these metals into nearby water bodies. Moreover, the steel and iron industries produce flue dust, which consists of particulate matter removed from the gases emitted during the production of Iron and Steel. These flue dusts from steel plants are susceptible to leaching at industrial sites, leading to the transport of heavy elements such as Cr, Mg, Fe, and Mn into surface waters. In addition to this, improper handling and disposal of chemical waste generated by the oil, pigment, and steel/iron industries could also contribute to river pollution in these areas. Apart from the higher concentrations of heavy elements, there has been a substantial 22-fold increase in Na levels observed in Savannah. This may be attributed to the brackish water resulting from the creation of estuaries near the mouth of the river [46-47].
Analysis of Savannah River Sediments
Sediments serve as a natural repository for pollutants, accumulating based on pollution levels. Assessing overall sediment quality involves considering data on sediment contamination, toxicity, and macroinfaunal condition. Heavy or toxic element contamination offers insights into contamination severity and its primary sources. To assess adverse biological effects, Long and Morgan's guideline values, Effects Range Low (ERL) and Effects Range Median (ERM) [48], are utilized. Concentrations below ERL suggest rare observed effects, while values above ERM indicate a higher likelihood of frequent adverse effects. Although not regulatory criteria, when concentrations exceed ERM values, the incidence of adverse effects is notably high. The USEPA has derived sediment screening values based on ERM, establishing Low and High alert levels for various elements. Table 3 summarizes element concentrations in locations surpassing USEPA's High Alert Level limits, indicating potentially elevated contamination levels in these areas.
Similar to the comprehensive water analysis conducted, an examination of sediment samples collected from the same 30 locations has unveiled significant findings. Element concentrations (Cr, Zn, Mn, Fe, Se, Ba, Mg, V, Al) exhibit remarkably higher levels in areas like McCormick, Augusta, Savannah, and downstream urban regions compared to upstream samples. Augusta stands out with increase in elemental concentrations, ranging from 2 to 7 times than those upstream. Among these elements, Zinc exhibits particularly enhanced concentrations, rising from a mere 128.42 mg/kg to an extremely high value of 1122.4 mg/kg. Savannah also shows substantial elevation, with levels 2 to 8 times greater than upstream, especially for Zinc, which peaks at 1405.86 mg/kg. Zinc concentrations in both Augusta and Savannah exceed the USEPA's high alert level by a factor of three [49]. Industrialized cities like McCormick, Augusta, and Savannah exhibit elevated Fe concentrations in sediment, 3 to 5 times higher than upstream and roughly three times higher than the EPA's high alert level. This trend is mirrored by Al, which exhibits concentrations 2 to 3 times higher than those upstream, primarily attributed to the automotive industries. Fe, Zn, Mn, and Mg are considered to be the main wastes from the steel and iron industries. The majority of anthropogenic releases of Ba are related to industrial operations that use chemicals containing barium. The manufacture of various products like glass, paints and rubber product and combustion of coal were estimated to account for the barium emissions [50]. Since there are multiple oil, paint, and rubber industries in McCormick, Augusta, and Savannah, the increased concentration of three times in these areas were noticed for Ba as compared to the upstream. These elevated levels in sediment may be caused by the industrial waste being dumped in the river. The values in the sediments for elements like Cr, V, and Mg were found to be lower than the EPA high alert level values.
Figure 4 presents a comprehensive comparison of the elemental concentrations in water and sediment samples collected from different locations along the Savannah River, namely Anderson (upstream), Augusta, and Savannah. It is assumed that the elemental concentrations in Anderson serve as a baseline, assumed to be representative of natural processes. The analysis focuses mainly on elements, including Al, Mg, Ba, Zn, Cr, Co, Mn and Fe. In the water samples, a discernible trend emerges, indicating a significant increase in the concentrations of these elements as the river progresses from Anderson to Augusta and Savannah. This observation suggests that there are additional sources contributing to the elevated concentrations downstream, beyond what can be attributed to natural processes alone. Moreover, the sediment analysis conducted at the same locations reveals the same pattern. The concentrations of toxic and heavy metals, specifically Al, Mg, Fe, Ba, and Zn show a notable escalation in Augusta and Savannah compared to the upstream location of Anderson. This implies that there may be anthropogenic activities or other factors in these urban areas contributing to the accumulation of these elements in both water and sediment. The higher concentrations of these elements in both water and sediment samples downstream from Anderson raise environmental and ecological concerns. Further investigation and monitoring are warranted to identify and mitigate potential sources of contamination, ensuring the health and sustainability of the Savannah River ecosystem.
Potential health effects from heavy metals
Savannah river provides drinking water to 1.4 million people primarily in two major metropolitan areas in Georgia, Augusta and Savannah, and assimilates their treated waste water [51]. Additionally, several smaller municipalities in South Carolina depend on the Savannah river as their drinking water source. Moreover, the river supplies water to various industries and chemical plants located along its banks. While water plays a crucial role in supporting life, contamination exceeding permissible limits can lead to the spread of diseases [52]. The presence of heavy metals in potable water beyond acceptable levels can cause damage at the cellular level, leading to the production of free radicals that may result in diseases such as cancer, damage to mental and immune systems, the intestinal tract, blood composition, lungs, kidneys, liver, and other vital organs [53-54]. Studies have shown that low-level exposure to Cr can cause skin irritation and ulcers, while prolonged exposure can cause kidney and liver damage and also complications in circulatory and nervous system [55]. Zn exhibits low toxicity in humans, but is relatively high toxic to fish [56]. Another heavy element with toxic effects on both humans and aquatic life is As. Arsenic (As) toxicity can lead to various health issues, including hyperpigmentation, the development of skin tumors, the onset of cancer, and significant harm to the gastrointestinal system and liver [57]. Cd is another highly toxic material to humans, and overexposure to Cd has been linked to damage to kidney [58], bone pain [59], and potential carcinogenic effects [60]. Fe is an essential nutrient critical for various bodily functions, but excessive exposure to Fe can lead to conditions such as diabetes, hemochromatosis, stomach issues, and nausea [61]. Similarly, Mn is necessary for human health, but excessive intake can be harmful. Prolonged consumption of water with high manganese levels may result in memory problems and attention issues, while infants may experience learning and behavioral problems [62]. Se is another vital element with significant biological roles, including anti-cancer, antioxidant, and immunomodulatory properties. However, elevated levels of selenium can lead to severe issues, including breathing difficulties, tremors, kidney failure, and heart failure [63]. Ag finds extensive applications across various industries, and its health effects vary depending on its chemical and physical form. Soluble silver compounds exhibit an enhanced propensity to be absorbed into biological tissues, thereby presenting an elevated risk to human health. For example, prolonged exposure to soluble silver compounds can result in argyria and argyrosis [64]. Furthermore, soluble silver compounds have an affinity for accumulating in the brain and muscles, though in small quantities [65]. The presence of Cobalt increases the incidence of goiter [66] and causes optical, cardiovascular and thyroid damage [67]. Though natural weathering is the major means of release of Al from soils and sediments to the surface waters [68], elevated concentration of Al in water systems is a grave concern, as it can potentially endanger the existence of aquatic organisms [69].
Limitations and way forward
Many substances are recognized as active water pollutants and are categorized into distinct groups. Among the various pollutants that pose potential threats to water quality, pathogens such as bacteria, viruses, and protozoa, inorganic pollutants including acids, salts, and toxic metals, organic compounds, and water-soluble radioactive substances stand out as significant contributors [33]. Surpassing a defined threshold value, these substances become harmful, instigating severe health issues in both humans and other organisms within the ecosystem. This study specifically focused on toxic and heavy metals within the Savannah River, employing the Instrumental Neutron Activation Analysis (INAA) technique. While INAA offers a highly precise estimation of elements, it is essential to note that the complete spectrum of heavy elements was not presented in this study. This limitation arises from the fact that the INAA technique is incapable of detecting elements that do not emit gamma rays upon irradiation and that produce gamma ray-emitting radionuclides with very short half-lives. Future research could employ alternative techniques or combinations of methods, such as INAA and radioanalytical techniques using Inductively Coupled Plasma Mass Spectrometry (ICPMS), to offer a more comprehensive analysis of heavy elements and organic pollutants in water bodies. This approach involves integrating multiple analytical methods to overcome the limitations of a singular technique, allowing for the detection of a broader range of polluting agents. Additionally, long-term monitoring studies help in refining these values, considering variations in environmental conditions, seasonal changes, and potential cumulative effects of multiple pollutants.
Conclusions
The INAA method was used to analyze the Savannah River from its source to the Atlantic Ocean, revealing excessive levels of heavy elements like Al, Cr, Fe, Ba, Mn, and Mg, mainly in urbanized and industrial areas. These contaminants are likely to originate from human activities, industries, and urban development. A spatial trend emerges as we move downstream, highlighting the need to pinpoint pollution sources, is vital for identifying potential pollution sources and assessing their environmental impact. Heavy metals can harm ecosystems, wildlife, and human health through the food chain, especially for those using untreated surface waters. Inadequate sewage, improper waste disposal, and oil spills contribute significantly to such surface water contamination in water bodies. Therefore, educating residents and increasing surveillance in coastal communities is crucial for enforcing environmental regulations.